
Deployment of New Simulation-based Casting Defect Prediction Technique
Highlight
Casting simulation has entered widespread use in recent years for design and to prevent defects. To make use of casting simulation, however, an understanding of fitting and modeling errors is essential. In practice, this means that much about the technique heavily depends on the skills of specific individuals. That is, even as more knowledge of analysis results and casting defects is acquired, human judgement is still needed to put this to use in subsequent predictions.
This article describes a technique that uses machine learning to match past analysis results with the defects observed in actual casting, using this to make expert decisions about fitting and modeling error on a statistical and objective basis.
1. Introduction
In recent years, simulation has come to be widely used in the computer aided engineering (CAE) of castings, including for design and for dealing with defects and flaws. Current standard practice when using CAE to make predictions about casting defects and other parameters is to first decide on the prediction model and then to perform the required calculations and output the prediction results. However, improving prediction accuracy when doing things this way calls for an understanding of both fitting errors and modeling errors. Here, “fitting” means the process of adjustment needed to make the actual results and CAE results match one another. The discrepancies that arise from poor fitting are called “fitting errors.” Modeling errors, meanwhile, are those that result from the CAE imperfectly replicating the real world. While progress in computing over recent years has brought a broad improvement in analysis accuracy, the complexity of the casting process makes it difficult to eliminate these errors completely.
Meanwhile, Professor Koichi Ozaki of the Applied Materials Laboratory at Okayama Prefectural University has proposed a new approach to this problem that seeks to improve accuracy in a very different way than that used in the past1), 2), 3). This has involved developing a method of formulating indicators for predicting defects by statistically and mechanistically matching the results of numerical analysis to how actual defects occur in practice. Hitachi Industry & Control Solutions, Ltd. has used this new technique as the basis for developing its Advanced Defect Prediction Tool (ADPT) and has incorporated it into its ADSTEFAN casting simulation system4). This article describes how ADPT is used to predict and prevent casting defects.
2. ADPT Defect Prediction Tool
2.1 Theory behind Formulation of Defect Prediction Indicators
Figure 1—Errors Involved in Using CAE for Casting and Relationship with Method for Formulating Defect Prediction Indicators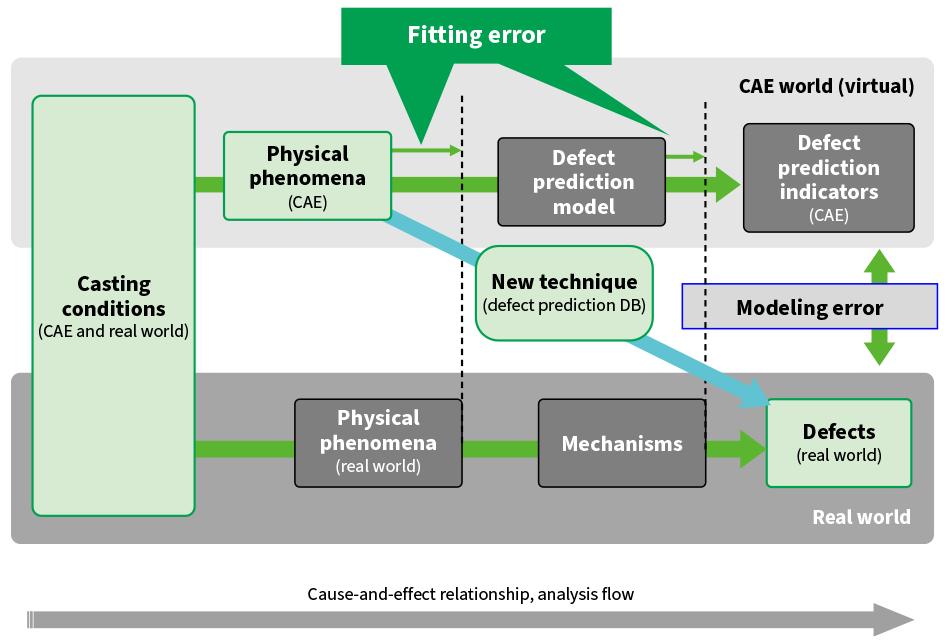 CAE: computer aided engineering, DB: databaseThe method for formulating indicators for defect prediction generates prediction indicators in a way that avoids the problems of fitting error and modeling error that afflict CAE. While the actual physical phenomena and mechanisms proceed simultaneously and interact in complex ways, they are shown here separately for simplicity.
As the choice of the specific factors and prediction models used in defect prediction indicators is based on conjecture, they are particularly prone to the influence of modeling errors. Likewise, fitting errors need to be taken into account when setting the thresholds for what constitutes a defect. Figure 1 shows how the new method for formulating defect prediction indicators deals with these errors.
The figure shows the cause-and-effect relationships between the phenomena involved in the casting process and the sequence of steps involved in analysis. The upper half of the figure shows the CAE virtual world and the lower half shows the real world. In the initial step, the base casting conditions (casting plan, materials, pouring temperature and rate, etc.) are the same for both CAE and the real world. When it comes to considering the individual physical phenomena, however, they diverge and follow different routes.
In the real world, casting defects arise from phenomena such as fluid flow and solidification acting by various different mechanisms. While the output of CAE takes the form of defect prediction indicators (at the top right of the figure), appropriate consideration needs to be given to the horizontal propagation of fitting error and the vertical action of modeling error if these are to provide a highly accurate indication of the defects that occur in actual castings (at the bottom right of the figure).
On the other hand, when the new method for formulating defect prediction indicators is used, the indicators avoid fitting error and modeling error by performing learning in a way that directly links the results from analysis with those from actual castings.
2.2 Functions of ADPT Defect Prediction Tool
As noted above, Hitachi has incorporated the ADPT defect prediction tool developed based on the new method for formulating defect prediction indicators into its ADSTEFAN casting simulation system. The tool has two main functions. The first function uses the results of numerical analysis and information about actual casting defects as teaching data for machine learning and automatically generates a prediction model that takes account of results from actual production in the form of a database (DB) of defect prediction indicators. Here, the results of numerical analysis refer to data corresponding to the physical phenomena for CAE shown in Figure 1. These include the flow rates, temperatures, pressures, and other parameters output by conventional fluid flow and solidification analysis. Similarly, the information about actual casting defects takes the form of a data set specifying the locations, types, and frequency of defects in products cast with the same casting conditions as used in the numerical analysis.
The second function uses the defect prediction DB to output values for the defect prediction indicators. By first performing a separate analysis of other casting conditions in the usual way, the function can then obtain the defect prediction indicator values from the prediction model implemented on the defect prediction DB by using the results of this numerical analysis as input to the DB.
3. ADPT and Fitting
This section describes the sequence of steps from creating the defect prediction DB used in ADPT to outputting the prediction values. The first step is to build the defect prediction DB using teaching data obtained from the results of conventional analysis and information on the actual defects that occurred for given casting conditions. As noted above, the analysis results include the temperatures, flow rates, pressures, and other parameters output by the fluid flow and solidification analysis in ADSTEFAN. As no actual castings have been made, fabricated data is used for the defect information. By using this data for learning, the defect prediction DB is created to predict defect occurrence rates (see Figure 2).
The next step is to input analysis results into the defect prediction DB and output the defect occurrence rate distribution. Figure 3 shows the defect occurrence rate distribution obtained when the analysis results themselves contained in the teaching data in Figure 2 are input into the DB. This indicates that casting misrun, sticking, and shrinkage defects have been broadly replicated. The analysis results and indicators generated by most conventional defect prediction practices do not give a direct indication of defect locations or frequency. Instead, these have to be determined intuitively by a human, taking account of modeling error after basic fitting for things like the temperature history. Deductive approaches to defect prediction like this, which are built on mechanistic foundations, struggle to formulate indicators that can yield results like those shown in Figure 3. Conversely, the use of ADPT, as shown in the figure, can produce the ideal output that the fitting process described above is intended to achieve. This new method for formulating defect prediction indicators uses an inductive approach that integrates results from multiple analyses to perform fitting in a statistical and objective manner. Consequently, it can be thought of as a function for indicating the degree of concordance with the actual results of past production.
On the other hand, machine learning brings its own problems and care is required in case the method is affected by these. While a high level of prediction accuracy can be anticipated when applied to new casting conditions that lie within the range covered by the teaching data, this accuracy will likely be diminished if the method is forced to extrapolate by applying it to casting processes, alloy grades, or product sizes that differ significantly from its teaching data.
Figure 2—Example of Teaching Data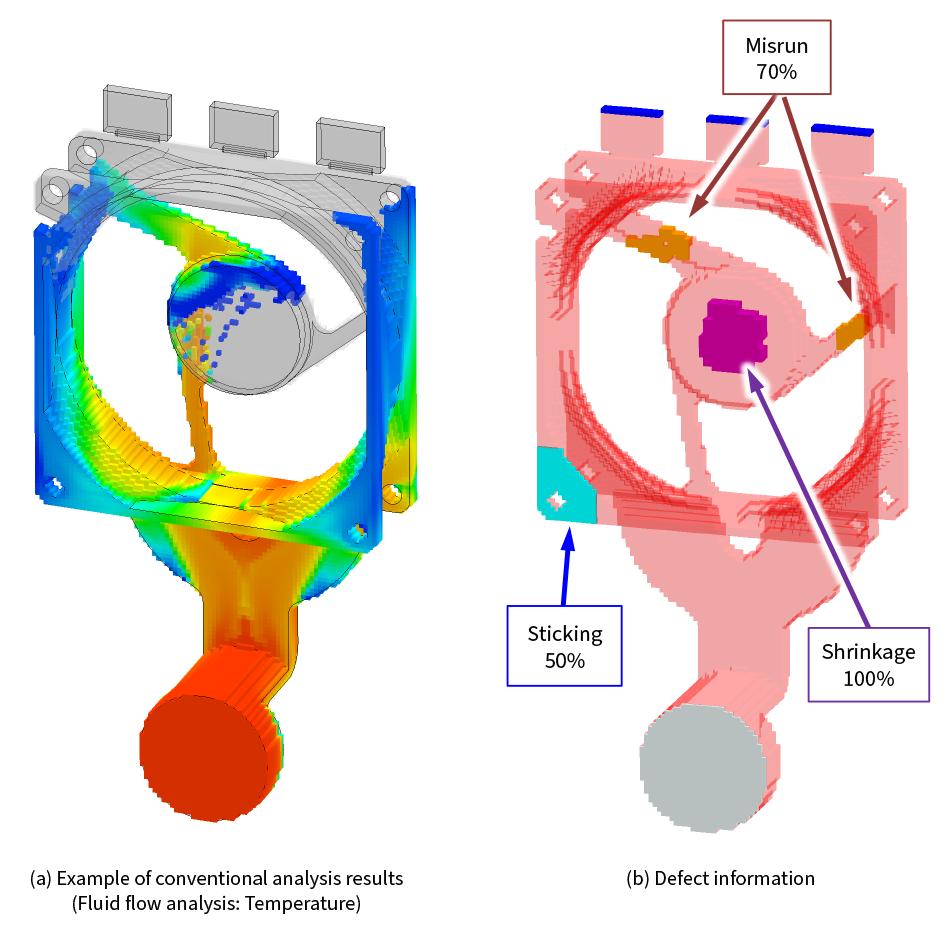 The teaching data used in the method for formulating defect prediction indicators is a combination of analysis results from given casting conditions and information about the actual defects (location, type, and frequency of defects) that occurred in products made under the same conditions.
Figure 3—Example of ADPT Output when Teaching Data Used as Input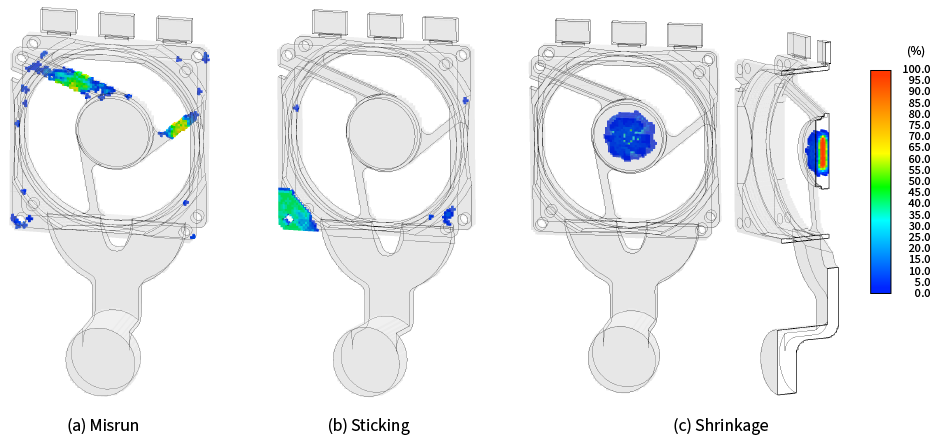 It is common for defect information to be accurately replicated when the teaching data itself is used as input to the defect prediction DB. Indictors that can generate output like this are the ultimate goal of conventional fitting.
4. Use to Prevent Defects
Figure 4—Example of Information Obtained from Defect Prediction DB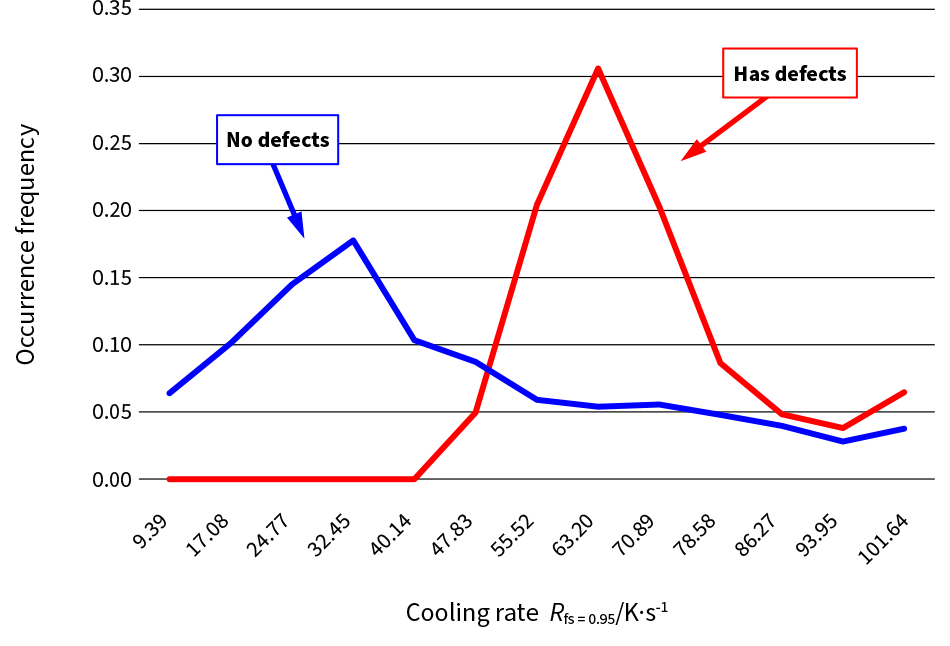 The defect prediction DB includes information from the teaching data on which factors contribute most to defects and the direction in which this influence is exerted. The graph shown here plots the frequency distributions for castings with and without defects with respect to the cooling rate, suggesting that defects could be reduced by reducing the cooling rate.
This new method can formulate indicators for defect prediction that avoid the effects of fitting error and modeling error. However, if high accuracy is to be maintained when the method is applied to a new product, sufficient teaching data needs to be acquired to ensure that the conditions used for the new product lie within the range covered by the defect prediction DB. In this regard, while the new method can reduce the influence of modeling error by automating the formulation of prediction indicators, this introduces a new form of fitting error that needs to be considered. In this context, while it is reasonable to assume that there are many obstacles to the practical implementation of the method, given that doing so requires the defect prediction DB to reach a degree of maturity, the benefits of the method go beyond automating the formulation of prediction indicators. In building the defect prediction DB, the method for formulating defect evaluation indicators can also output intermediate results in the form of diverse analysis information about defects in existing products. This section describes how the method can leverage this analysis information to prevent defects in existing products.
4.1 Analysis of Contributing Factors
The intermediate results generated by the method for formulating defect prediction indicators include information on the ranking of factors that contribute to defects. While many machine learning models are black boxes that provide no insight into which factors contribute to their conclusions, the technique used here can identify these factors and can rank them by their degree of influence. Performing learning using the teaching data shown in Figure 2 identifies the factors that have a strong influence on sticking, misrun, and shrinkage defects and outputs information analyzing how defects are influenced by changes in these values is output as a defect prediction DB. Figure 4 shows an example in which cooling rate was identified as the dominant factor influencing shrinkage defects. This figure plots the frequency distributions for castings with and without defects obtained by treating the teaching data information as actual results. As this technique enables the separate output of these frequency distributions, it is possible to estimate the defect occurrence trend based on how they correlate with one another. The example in the figure shows the possibility that defects can be reduced by reducing the cooling rate.
4.2 Practical Application to Defect Prevention
While the method for formulating defect prediction indicators can specify which factors have an influence on actual defects and in which direction to change them to reduce occurrences, the complex interactions between these factors make it difficult for a human to predict what will happen if they are modified. With ADPT, however, it is easy to provide a visual representation of what will happen if modifications are made.
Figure 5 shows the predicted defect occurrence rate by a test in which the inputs to the defect prediction DB were obtained by repeating the analysis with a 20% reduction in the values of the pouring rate and the coefficient of heat transfer between the casting and mold. The results indicate that this would significantly reduce all three forms of defects.
Figure 5—Visualization of Effects of Modifying Casting Conditions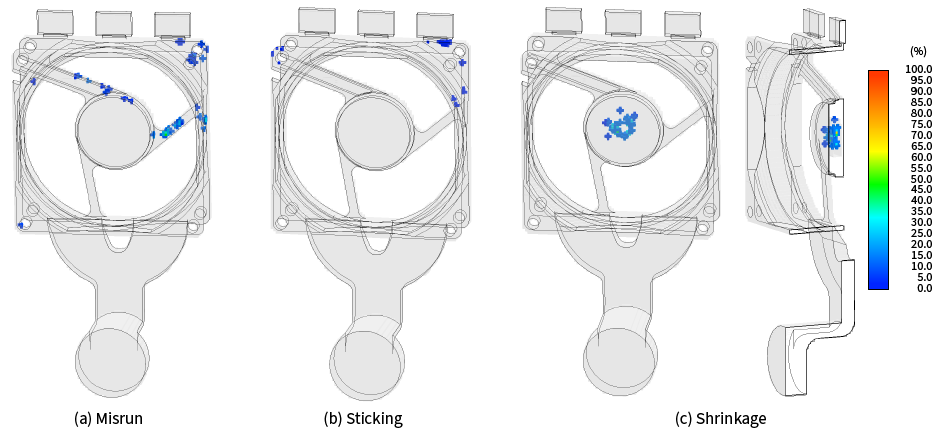 Performing an analysis using modified casting conditions and inputting the results into the defect prediction DB can provide a clear visual representation of how well the modifications have worked.
4.3 Issues
The method for formulating defect prediction indicators includes a function similar to machine learning that uses an inductive approach whereby predictions are based on the factors that contribute to defects. As a consequence, the prediction accuracy is strongly influenced by the quality and quantity of the teaching data and the quality of the resulting model. It works by automatically generating a regression formula based on frequency distributions that in turn are obtained from the conditions in the teaching data and from data indicating defective or sound areas in actual castings. As this does not take account of any physical cause-and-effect relationships, it has the potential to also identify unexpected correlations. This may enable more accurate predictions by identifying important factors that were not considered by previous methods.
Conversely, there is the potential for prediction accuracy to be degraded if the teaching data is insufficient or of poor quality, causing irrelevant factors to have a greater influence. If the quantity of teaching data used to generate the frequency distributions is small, the results will be more prone to influence by outlier values. Furthermore, as the method works by producing a probability distribution, it cannot obtain quantitative results based on physical phenomena. With conventional shrinkage cavity prediction functions, for example, the sum of the cavity volumes would be equal to the amount of shrinkage during solidification. The new method, in contrast, outputs the defect occurrence rate distributions that would be obtained if castings were produced using the given casting conditions an infinite number of times and has nothing quantitative to say about cavity volumes. This means that care is required when interpreting the prediction results.
5. Conclusions
As past techniques based on deductive defect prediction formulated their defect prediction indicators using a limited number of factors chosen on the basis of conjecture, considerable knowledge and experience were required to make predictions in a way that took appropriate account of important hidden factors. In contrast, the current version of ADPT (ADSTEFAN Ver. 26) is based on the inductive approach of the new method for formulating defect prediction indicators and performs learning on approximately 80 different results output from fluid flow, solidification, and thermal stress analysis, enabling it to formulate defect prediction indicators that are multi-faceted and tailored to actual practice. In the future, Hitachi intends to improve the performance and enhance the functionality of this tool while also expanding the number of factors it considers.
REFERENCES
- 1)
- T. Kanzaki et al., “Study on Injection Molding of Mg Alloy Defects Prediction used Simulation,” Proceedings of The Computational Mechanics Conference, Japan Society of Mechanical Engineers, Vol. 2011.24, pp. 655 to 656 (2011)
- 2)
- N. Kimura et al., “Prediction of casting defect by using of numerical simulations,” The Proceedings of Conference of Chugoku-Shikoku Branch, Japan Society of Mechanical Engineers, Vol. 2013.51, pp. 203-1 to 203-2 (2013)
- 3)
- R. Akiyama et al., “Determination of Defect Occurrence Function of Injection Molded Magnesium Alloy Products by Numerical Simulation,” Annual Conference, Japan Society of Mechanical Engineers, 2014, p. G0110105- (2014)
- 4)
- Hitachi Industry & Control Solutions, Ltd., Casting Simulation System ADSTEFAN