Use of GNSS for Visualization and Assessment of Operational Performance Estimation of Energy Savings on Hankyu Takarazuka Line
Highlight
The railway industry is taking steps to improve its energy efficiency in response to issues that include environmental problems and lower income following COVID-19.
This article considers the energy efficiency possibilities and benefits of optimizing the speed profiles used by operating trains, describing the assessment processes and outcomes of using GNSS data for this purpose on the Takarazuka Line operated by Hankyu Corporation.
1. Introduction
Railway operators have been actively pursuing energy efficiency measures both to address environmental challenges and to respond to the decrease in income they have experienced due to COVID-19. In addition to earlier work on improving rolling stock and traction systems, recent years have also seen more widespread efforts to optimize the speed profiles used by operating trains. By adopting more energy-efficient speed profiles, operators can reduce the extent to which their operating practices cause variability in power consumption and obtain large overall energy savings1).
Figure 1—How Driving Performance Reviews are Conducted GNSS: global navigation satellite system, PDCA: plan, do, check, actThe concept is to provide operations divisions at railway companies with suggestions on how to improve the energy efficiency of train driving that are based on the analysis and visualization of data logged from train operation. By using this information in the PDCA process for operating practice planning, this can help improve how trains are driven in actual operations.
One way to reduce speed profile variability is to install automatic train operation (ATO) systems and driver advisory systems (DASs). Unfortunately, the installation cost is an obstacle to adopting such systems as this also requires upgrades to other ground-based and onboard equipment. One comparatively low-cost measure for overcoming this obstacle that was proposed in previous research2) is driver training based on a review of past driving performance. Figure 1 shows how this is done. The training system works by recording actual speed profiles and then helps drivers subsequently use this information to improve their own driving performance, such as when they have free time. This involves playing the profiles back alongside data such as journey time and power consumption. The drivers’ supervisors, meanwhile, can analyze speed profile trends from different sections of track and use this as a basis for instructing drivers.
At a bare minimum, operating data on train location and speed are needed to put this method into practice. One way of acquiring accurate locations and speeds would be to get this data from the monitoring systems that record this information. Unfortunately, one obstacle to installation is that upgrades would be needed to these monitoring systems to enable large amounts of data to be collected in an efficient manner. Another problem is that the method could not be used on trains that do not have such systems installed.
Another way to put the method into practice without connecting to monitoring systems would be to use a global navigation satellite system (GNSS). This would involve equipping rolling stock with devices that have GNSS reception capabilities and calculating train location from the latitude and longitude values they provide. Such devices can also provide train speed data. As GNSS capabilities have in recent years become a standard feature on general-purpose devices such as smartphones and tablets, such devices provide an easy way to collect location and speed data. By using a GNSS, the actual speed profiles between stations can be calculated from the train location and speed data received from the devices. Similarly, methods have already been proposed for calculating journey times from station departure and arrival times and for estimating power consumption from speed data3).
Previous research4) investigated the visualization of operational data based on GNSS data acquired by a tablet computer. This reported on the results of trials conducted on the Yamanote Line of the East Japan Railway Company. It compared GNSS data from one full loop of the Yamanote Line with the data from a monitoring system. While this found that speed profiles could be accurately replicated and used for operational playback for those sections of track where accurate location data could be obtained, it also reported that unreliable GNSS reception was an impediment to use of the data for reviewing performance. This happens when the acquisition of location data is interrupted in places where obstructions above or near the railway line shield the GNSS signal. It seems likely that this result was influenced by the fact that the trial was conducted on the Yamanote Line, which runs through central Tokyo and is especially prone to signal shielding by railway station complexes or other nearby buildings.
The research being reported here, in contrast, involved temporarily installing GNSS-equipped devices on in-service rolling stock and collecting 55 continuous days of GNSS data from operation on a railway line where location data could be obtained with a comparatively high level of accuracy. This article reports on the results of using the data acquired from this trial to analyze speed profile replication and the variability of speed profiles, journey times, and power consumption. The article also reports on the results of studying energy-efficient speed profiles, including an estimate of how much energy could be saved if the variability of speed profiles could be reduced.
2. Acquisition of GNSS Data
2.1 Data Collection Device
The device used to collect GNSS data was a Microsoft*1 Surface*1 Pro X LTE tablet computer on which GNSS data recording software had been developed and installed. The device obtains GNSS data using the Assisted Global Positioning System (A-GPS ) and the Global Navigation Satellite System (GLONASS). Assisted GPS is augmented by the device’s mobile communications function while GLONASS is a Russian satellite navigation system. The specifications are such that the GNSS data is acquired at one-second intervals.
2.2 Geographic Scope and Duration of Trial
GNSS data was collected from the Takarazuka Line operated by Hankyu Corporation and analysis was performed on express trains for the section of track between Juso and Toyonaka stations, which is the longest distance between consecutive stops on the line. This section of track was chosen because the long distance between stations provides a high level of operating practice flexibility and so it can be expected to result in a comparatively high degree of speed profile variability. Also, the GNSS data reception quality in trains operating along this section of track was checked prior to the temporary installation of the recording devices to confirm that the positions and speeds could be acquired with minimal interruptions.
Data was collected for 55 days from December 13, 2023 to February 5, 2024. However, data was only collected for trains running at off-peak times between 10 AM and 4 PM when there would be less risk of operation being affected by other trains.
2.3 Temporary Installation
Two recording devices were used, one was installed in a 1000 Series variable-voltage variable-frequency (VVVF) train and the other in a 6000 Series train that lacked a monitoring system and used rheostatic control. The devices were located in the driver’s cab of the lead car at the Osaka-Umeda Station end of the train. The devices were installed by attaching their housings to the door between the driver’s cab and passenger compartment and power was supplied from the train’s electricity system.
After using the onboard base station to check GNSS reception quality at various locations inside the railcar, this installation location was chosen to ensure that a reliable signal could be acquired, that the device would not obstruct the driver, and that a power supply would be available.
2.4 Data Acquisition
The GNSS data was collected successfully, with the two recording devices operating without problems across the 55 days of data collection. For the 10 AM to 4 PM analysis period, 56 samples each were collected from the 1000 Series train for the inbound and outbound directions, respectively, and 33 inbound and 32 outbound samples were collected for the 6000 Series.
- *1
- Microsoft and Surface are registered trademarks or trademarks of Microsoft Corporation in the USA and other countries.
3. Method Use to Replicate Actual Operation
This section describes how each of the actual values are replicated or determined from the GNSS data collected by the method described above.
3.1 Kilometerage
As the position information obtained from the GNSS data is in the form of latitude and longitude values, it first needs to be converted into the more commonly used metric of Kilometerage, indicating location along a railway line. Accordingly, a database of the relationship between latitude/longitude and Kilometerage was created to enable this conversion. This was done by mapping a number of landmarks in the track plans (for which both the latitude and longitude and the distance along the railway line were known) onto a list of latitude and longitude values obtained by tracing the path of the railway line in Google Maps*2. This enabled the conversion of the latitude and longitude values logged during train operation to a Kilometerage value.
3.2 Train Speed
The speed data included in the received GNSS data was used for the train speed values. However, because the raw speed data is affected by small fluctuations that occur over a period of seconds, the values were subject to moving average filtering to minimize this distortion prior to their use for visualization and other calculations.
Another issue was the unreliability of GNSS speed data when arriving at or departing a station due to the railway station or other buildings. This was resolved by replacing any speed profiles that were below the prescribed speeds for station arrival and departure with speed profiles that followed the prescribed acceleration or deceleration rates that would apply when notch (throttle setting) control is used as it typically would be during normal operation.
The first step was to determine the speed profile for the period before and after the time spent between stations (t3) and to obtain the times (t2 and t4) when the prescribed low speed (Vstop) is reached. The speed profile for a train departing a station is obtained by assuming that the prescribed acceleration rate is used and then working backwards from the (t2, Vstop) location to determine when the speed falls to zero. This becomes the estimated departure time (t1). Similarly, the speed profile for station arrival is determined by assuming that the prescribed deceleration rate is used and then working forwards from the (t4, Vstop) location to determine when the speed falls to zero. This becomes the estimated arrival time (t5).
3.3 Journey Time
The journey time is calculated from the difference between the departure and arrival times. The departure time is the time at which the train speed in the above data changes from zero to a positive value at the departure station. Similarly, the arrival time is when the speed changes from a positive value to zero at the arrival station.
3.4 Powering Energy Consumption
The analysis of power consumption was done by considering powering energy consumption. This was done to eliminate any influence from other trains and only assess the power consumption associated with the movements of the train on its own. Accordingly, power consumption for travel between stations was calculated for traction power only, ignoring any regeneration.
The method for estimating powering energy consumption was based on previous research.2) This involved first using the equations of motion to determine the output traction energy from the acceleration (obtained from the derivative of train speed), train mass (determined from estimated vehicle occupancy), and train drag (calculated using a formula for running resistance). The amount of powering energy consumption for travel between stations was then determined as the input electric power obtained from this calculation, provided that this value was positive (indicating traction).
A fixed value of 30% was used for the vehicle occupancy in this calculation, this being obtained from visual observation of actual passenger numbers during the 10 AM to 4 PM period covered by the analysis. For running resistance, the formula stipulated in the Japanese Industrial Standards (JIS) was used. Similarly, the efficiency values that typically apply for inverter-driven and rheostatically controlled rolling stock respectively were determined and these were used as the output efficiency values in the input power calculation.
- *2
- Google and Google Maps are trademarks or registered trademarks of Google LLC.
4. Visualization and Analysis Results
The following sections describe the visualization and analysis results.
4.1 Assessment of Speed Profile Accuracy
Figure 2—Example Comparison of Monitoring System and GNSS Speed Profiles Although a difference in speed of more than 5 km/h occurred when passing through Mikuni Station, the accuracy is sufficient for determining train speed at a macro level.
The accuracy of GNSS speed profile replication was assessed by comparing the GNSS data against operation records from the monitoring logs (driving status log) on the 1000 Series train.
The results indicated that, although some minor speed deviations were present due to poor GNSS reception, the accuracy with which GNSS data could replicate train operation was sufficient for determining the macro speed profile over the entire inter-station distance. Figure 2 shows an example comparison. The red circle highlights an instance where the difference in speed exceeded 5 km/h.
The speed profile often deviated from the correct value when passing through Mikuni Station. As the station has a large building facing its outbound platform, it seems likely that this is degrading the accuracy of the GNSS speed data. It was also found that speed deviations occurred at particular locations at some times but not others. This is believed to depend on satellite location, whereby small obstructions have an effect on accuracy in those instances when the number of satellites able to be acquired for positioning is low.
4.2 Speed Profile Variability
Figure 3—Example Speed Profile Variability for Trains Running from Juso to Toyonaka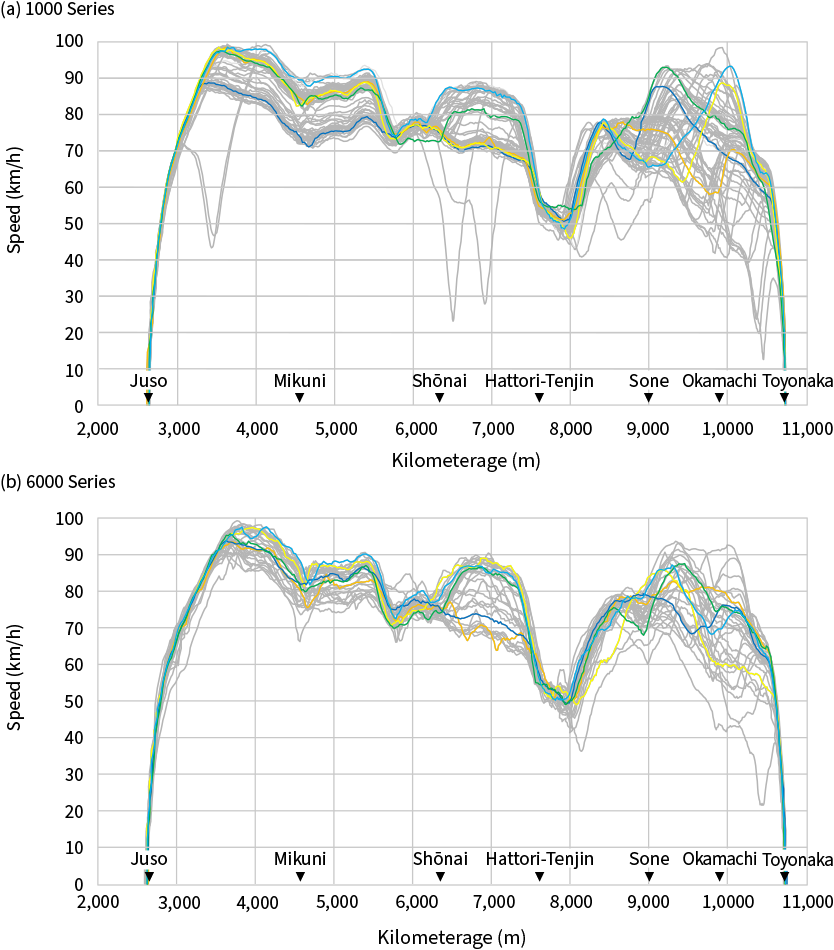 When trains are traveling at maximum inter-station speed, the speed of the train when it stops accelerating varies by about 10 to 30 km/h.
The GNSS-derived speed profiles for each train and travel direction were overlaid on one another to assess the level of variability. Figure 3 shows the visualization results for trains running from Juso to Toyonaka. The following color-coding is used in the figure to indicate five different types of speed profile.
- Energy-efficient profile with a journey time within ±1 s of the prescribed time (orange)
- Non-energy-efficient profile with a journey time within ±1 s of the prescribed time (yellow)
- Energy-efficient profile with a journey time within ±10 s of the prescribed time (blue)
- Non-energy-efficient profile with a journey time within ±10 s of the prescribed time (green)
- Fastest profile (light blue)
For those parts of the speed profile where the trains are traveling at maximum inter-station speed (a number of such peaks are present between stations), the speed of the train at the time when it stops accelerating varies by about 10 to 30 km/h. This occurs for both trains and both travel directions. This indicates that there are differences in the choice of where to make up journey time between stations depending on the train driver or operating conditions. There are also instances where, when approaching its next stop, the train either does or does not speed up again after first slowing down. It is likely that this behavior is influenced by the signals present when entering the station.
4.3 Variability of Journey Time and Powering Energy Consumption
Figure 4—Example Journey Time Variability for Trains Running from Juso to Toyonaka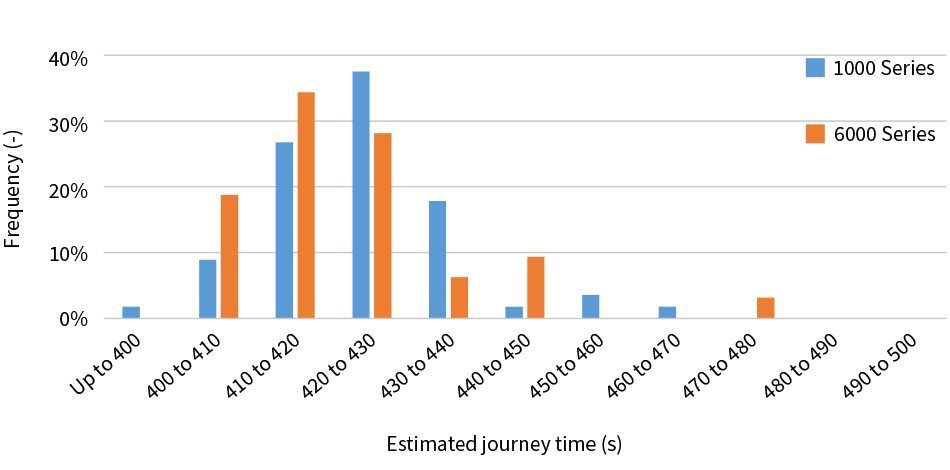 The data approximated a normal distribution, with approximately 60% of the data for both trains falling within the 410 to 430 s range containing the peak in the distribution. The frequency peaks for the two trains were different.
The journey times and powering energy consumption for each sample were estimated for each train and travel direction. Figure 3 shows a frequency histogram of the estimated journey times.
- Variability of estimated journey time
The data for trains running from Juso to Toyonaka approximated a normal distribution, with approximately 60% of the data for both trains falling within the 410 to 430 s range containing the distribution peak (64% for the 1000 Series and 62% for the 6000 Series). There was also a tendency for the 6000 Series to have more instances of slightly shorter journey times.
For the data on trains running from Toyonaka to Juso, the distribution was biased toward shorter journey times, with more than 50% of journey times being shorter than 420 s for both trains.
- Variability of estimated journey time and estimated powering energy consumption
Figure 5—Example Variability of Journey Time and Powering Energy Consumption for Trains Running from Juso to Toyonaka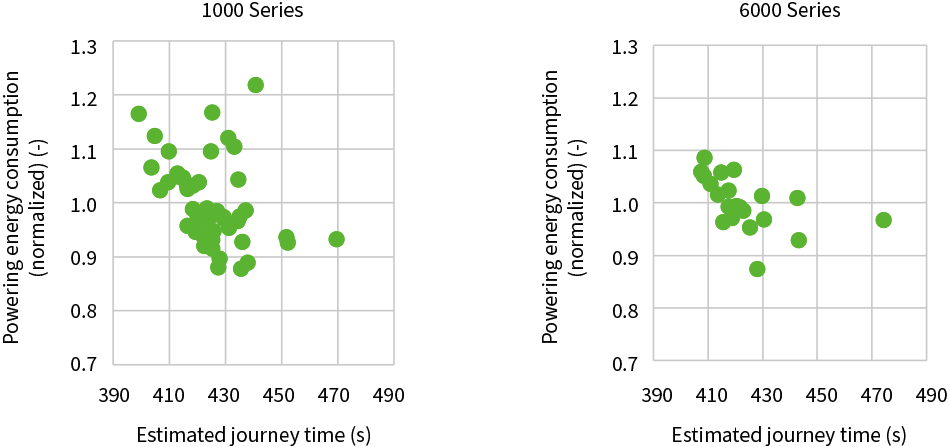 The correlation is negative for journey times of 430 s or less.
Figure 5 shows scatter plots of estimated journey time against estimated powering energy consumption. Here, the estimated powering energy consumption is represented using normalized values calculated by dividing by the mean values for the corresponding travel direction and train.
The data for both trains in the Juso-to-Toyonaka direction shows a negative correlation for journey times of 430 s or less. This is what would be expected. Moreover, in the case of the 1000 Series, the data is biased toward lower values of powering energy consumption. There are few data points from both trains in the 440- to 470-s journey time range and this lack of data makes it difficult to compare the distributions for the two trains.
4.4 Calculation of Potential Energy Savings
Comparisons were made of the mean and minimum values of estimated powering energy consumption for both trains and travel directions. That is, if energy-efficiency measures were to be adopted whereby all trains running within the relevant journey time range could do so in a way that consumed the least amount of electric power, this would indicate the maximum available energy savings. The formula for calculating this potential for energy savings is as follows.
Potential energy saving (%) = (Mean − Minimum) / Mean × 100
Here, the dataset used for the calculation is limited to those samples for which the journey time is within ±10 s of the prescribed time. Similarly, the mean and minimum values are for the estimated powering energy consumption from samples in this time-range dataset and are normalized by dividing by the mean of all data for the corresponding travel direction and train.
Figure 6—Example Calculation of Potential Energy Savings for Trains Running from Juso to Toyonaka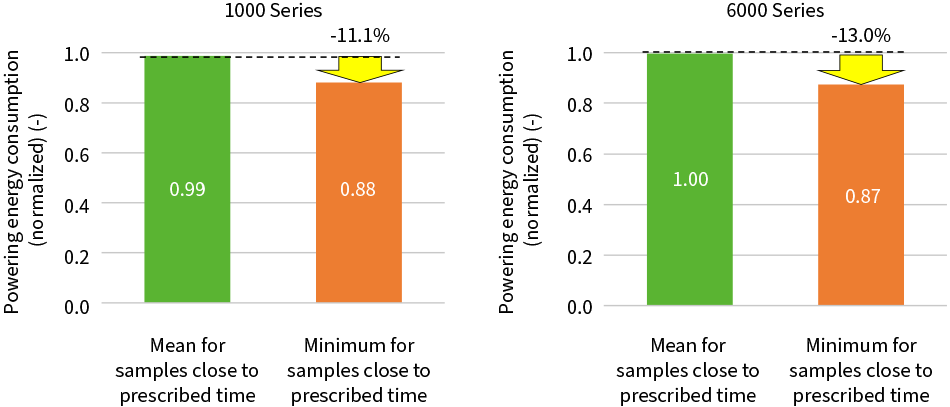 The potential energy savings were 11.1% for the 1000 Series and 13.0% for the 6000 Series.
Figure 6 shows the potential energy savings for trains running from Juso to Toyonaka. In this direction, there is potential for energy savings of 11.1% on the 1000 Series train and energy savings of 13.0% on the 6000 Series. The equivalent savings in the Toyonaka-to-Juso direction are 16.3% for the 1000 Series and 9.9% for the 6000 Series. These results of potential energy savings in the 10% range are similar to those found in past research by another company1). As can be seen in the Figure 5 scatter plot, fewer operating data samples are available for the 6000 Series than for the 1000 Series. While this means that the results could change somewhat if more such data became available, it is anticipated that the potential energy savings would remain in the same ballpark. Note, however, that these results are estimates and do not consider the operational factors that apply during commercial operation. As such, it should be kept in mind that, if energy efficiencies were adopted in practice, these results would not necessarily match the actual energy savings achieved.
4.5 Characteristics of Energy-efficient Operating Profiles
Figure 7—Example Energy-efficient Speed Profile for Trains Running from Juso to Toyonaka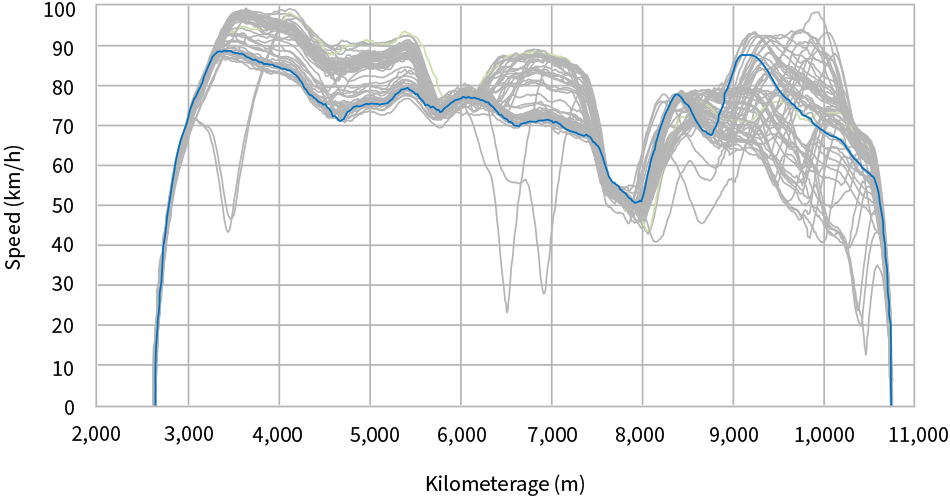 The representative energy-efficient profile keeps its top speed to a minimum when traveling at maximum speed between stations but keeps the speed close to the limit when traveling on sections of track where the speed limit is low.
Based on the above estimates of potential energy savings, the characteristics of the speed profiles for the operating data in the target journey time range that resulted in the lowest power consumption were reviewed. These are referred to here as “representative energy-efficient profiles.” The review identified characteristics by performing a comparison of the speed profile variability described above. While the results of this review are explained below using the 1000 Series as an example, the same trends were found for the 6000 Series. Figure 7 shows the representative energy-efficient profile for trains running from Juso to Toyonaka. The grey lines are the speed profiles from the dataset (collected operational data) and the blue line is the representative energy-efficient speed profile.
While the dataset included instances where the maximum inter-station speed approached 100 km/h, the representative energy-efficient profiles for both directions do not exceed 90 km/h. That is, whereas the dataset showed a variation of between 10 and 30 km/h in speed when trains were traveling at maximum inter-station speed, the representative energy-efficient profiles for both directions were at the bottom end of this range. On the other hand, whereas the dataset showed a variation of about 10 km/h in the speed when running on sections of track with a speed limit below 60 km/h, the representative energy-efficient profiles had comparatively high speeds in these regions. Similarly, the representative energy-efficient profiles had a slow rate of deceleration when braking to stop at the station and did not exhibit the resumption of acceleration after decelerating to a slow speed that can be seen in some of the samples in the dataset.
From this analysis, it was deemed that representative energy-efficient profiles have the following characteristics.
- Representative energy-efficient profiles keep their top speed to a minimum when traveling at maximum speed between stations but keep their speed high (but below the limit) when traveling on sections of track where the speed limit is low.
- This policy of using a low rate of acceleration at high speeds (where power consumption is high) but keeping close to the speed limit on the low-speed sections of track (which have a large impact on journey time) conforms with the theory for how to achieve energy-efficient operation.
- While the influence of preceding train departures when arriving at a station makes it impossible to generalize about operation prior to braking to a halt, because the representative energy-efficient profiles keep the maximum speed down during the early and middle stages, they will not catch up with the preceding train and so are less likely to require unnecessary slowing down and speeding up. Operating this way reduces power consumption.
5. Conclusions
This article has presented a technique for improving the energy efficiency of railway operations that uses GNSS to provide a means of operational performance visualization that is suitable for a wide range of situations and is not affected by differences in the equipment and functions available on different trains. This has included a description of the process used to verify its viability and the results obtained.
As the journey time and power consumption values obtained in this study were estimated based on a number of assumptions, there is a limit to how accurate they will have been in absolute terms. Care is required in the handling and interpretation of these values and use of this GNSS-based method should be informed by knowledge of its limitations. On the other hand, as explained in the article, the form of the speed profiles obtained is sufficiently accurate for practical use and the technique has the potential to be a valuable tool for reviewing daily operations. In addition to energy efficiency improvement, there is also scope for using the technique in driver training and skills transfer.
REFERENCES
- 1)
- East Japan Railway Company, JR East News, “Research on Energy-saving Operation on the Yamanote Line to Reduce Operational Energy” (Sept. 2021) in Japanese.
- 2)
- A. Oda, et al., “Development of System for Visualization on Operating Technology,” Proceedings of Symposium of Japan Railway Engineers' Association, No. 54 (Nov. 2017) in Japanese.
- 3)
- A. Oda, et al., “Accuracy Evaluation of Energy Consumption Estimation Based on Velocity Data,” National Conference, Institute of Electrical Engineers of Japan, Presentation G306-C3 (Mar. 2019) in Japanese.
- 4)
- S. Iso, et al., “Research into Practical Deployment of Tablet-based Driving Support Tool,” Japan Railway Engineers' Association, Vol. 66 (Sept. 2023) in Japanese.


