
Application of Environmental Noise Monitoring System to Factory Equipment
Highlight
Hitachi Power Solutions Co. Ltd. supplies monitoring systems for determining noise levels at the boundaries of industrial sites. The product provides continuous unattended monitoring of the level of noise from a plant, using machine learning to automatically identify unrelated sounds such as automobile noise or insect calls.
However, these system capabilities have potential uses beyond the measurement of noise levels at the edges of industrial sites, including monitoring plants for abnormal behavior or warning signs of equipment failure.
This article describes the component parts and key technologies used in these systems for monitoring noise at industrial sites as well as the results of investigating their potential use for equipment monitoring. The article also considers future developments where the system could also be used for multi-purpose monitoring of variables such as odor or temperature in addition to noise.
Introduction
The noise of plant operation has long been an issue for the manufacturing industry, with companies needing to keep noise to an appropriate level to maintain harmonious relations with their local communities. This in turn has created a need for systems that can measure noise levels efficiently over long periods of time. These noise monitoring systems can be divided into systems that are used for environmental management, measuring the noise levels at the site boundary line, and systems used for purposes such as fault detection that measure noise levels adjacent to machinery. This article starts by considering the issues associated with the former, providing a system overview and a summary of their features, and then goes on to describe how they can also be used in the latter application.
Boundary Line Noise Monitoring Systems for Industrial Sites
Challenges of Measuring Noise Levels at Site Boundaries
Noise levels at industrial site boundary lines are measured for a variety of reasons. Among the most common of these are checking that the noise level measured at the site boundary complies with noise control laws and keeping track of site boundary noise levels out of consideration for the neighboring community. For this reason, many industrial sites track their noise levels by having someone, such as the department responsible for environmental management, take regular measurements at the site boundary.
In doing so, the person or department charged with this task will face the following difficulties. Most of these are the result of taking periodic manual measurements.
- As measurements are taken at regular intervals, noise levels on days when no measurement is made are unknown.
- It takes a lot of effort to cover the entire boundary at large sites.
- As permitted noise levels vary by the time of day, measurements must also be taken at night.
- As site boundaries are often bordered by roads, measurements need to be taken at times or places where the sound of passing cars is absent (calling for a degree of proficiency in the person making the measurement).
Overcoming these difficulties requires a system that uses appropriate methods to collect and monitor acoustic noise data unattended.
Overview of Boundary Line Noise Monitoring Systems for Industrial Sites
As noise monitoring systems for industrial site boundaries must be able to acquire accurate raw measurements (noise levels), they typically incorporate a sound level meter. A variety of different configurations are possible for such systems, depending on how the sound level meter is connected (automatic measurement by a standalone meter, using a general-purpose data logger in tandem with the meter, or using a dedicated noise monitoring system) and how the measured data is stored (whether on-site or in the cloud).
Having listened to customers’ needs and considered the different configurations, Hitachi Power Solutions Co. Ltd. has chosen to supply a system for use at sites such as factories or power plants that is configured specifically for noise monitoring (called the “real-time noise monitoring system”) and that gives customers the choice of either on-site or cloud data storage(1).
System Configuration and Core Functions
Figure 1—Example Configuration of Real-time Noise Monitoring System DB: database, PC: personal computerThe data from the sound level meter is collected on a server from which it can be viewed as trend graphs on a client PC or replayed as audio recordings.
Figure 1 shows an example configuration for the real-time noise monitoring system. The main components are the sound level meter, data storage unit, server, and client personal computer (PC).
Two types of data are acquired from the measuring instrument: noise levels and audio recordings of the captured sound. The noise level data is acquired continuously as equivalent noise levels over a one-second interval in one-third octave bands across the frequency spectrum from 20 Hz to 20 kHz. The audio recordings were added to enable auditory checking and are saved in 24-bit/51.2-kHz WAV format to enable subsequent signal processing such as fast Fourier transformation (FFT).
As the larger data volume of the audio recordings compared to noise level data places a greater load on the data communication network, functions are included to compress the recordings prior to transmission or to only transfer this data when particular events occur, such as exceeding a threshold (which can be specified separately for different times of day).
Use of Machine Learning for Sound Identification
A key feature of the real-time noise monitoring system is its function for using machine learning to identify sounds. This function allows noise analysis on the system to identify blocks of data that do not include sounds from outside the plant (extraneous sounds), such as automobiles, aircraft, or insects. That is, sounds not attributable to the plant.
The system uses Mahalanobis-Taguchi (MT) machine learning, with the spectrum data collected in one-third octave bands used as the input. Figure 2 shows an example where the system is used to identify extraneous sounds. The graph in the figure shows the measured noise level and the degree of abnormality determined by MT machine learning (a value indicating the extent to which the measurements diverge from normal data). The regions enclosed in dotted lines represent time periods when a speaker was used to simulate extraneous sound. These measurements show how the degree of abnormality is higher when extraneous sound is present. Time periods with a degree of abnormality above a certain threshold can be treated as unrepresentative and therefore excluded from noise level assessment.
Figure 2—Example Use of System to Identify Extraneous Sound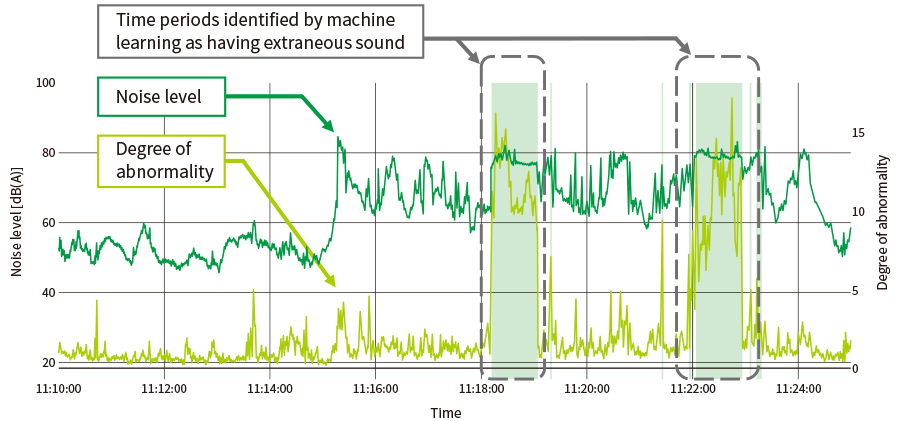 The figure shows trend graphs of noise level and degree of abnormality. The regions enclosed in dotted lines represent time periods when a speaker was used to simulate extraneous sound and the shaded regions are the time periods where the system detected the presence of extraneous sound.
Use of Real-time Noise Monitoring System for Equipment Monitoring
Industry is making greater use of equipment monitoring systems equipped with vibration, temperature, and other such sensors. Unfortunately, while these systems may be able to detect various anomalies using sensors attached to different types of equipment, this in many cases still results in an inspector being urgently dispatched to the site to conduct a detailed investigation in person (to confirm whether there really is a problem, to determine which equipment is involved, and to identify the location of the problem).
On the other hand, while sound by its nature makes it difficult to determine with any precision which equipment is behaving abnormally, the use of sound for equipment diagnostics, especially in configurations that feature omnidirectional microphones, does allow for the monitoring of multiple machines at the same time. Given the difficulty, explained above, of eliminating human intervention entirely from practical applications for equipment diagnostics, the ability to monitor a wide area using a small number of sensors does nevertheless offer considerable efficiency benefits.
As described in the previous section, the real-time noise monitoring system from Hitachi Power Solutions is equipped with a function for determining the extent to which the measurements being collected differ from normal. This means that its system configuration is already suitable for equipment monitoring applications.
How Anomalies are Detected
As for monitoring noise at site boundaries, the diagnostics process involves calculating the degree of abnormality by using the spectrum data collected in one-third octave bands as the input to MT machine learning. As the use of one-third octave bands mimics the characteristics of human hearing, this method should work for the sort of audible anomalies that can be picked up by a person walking around the plant. As audible anomalies generally manifest shortly before an equipment failure, diagnosis by means of vibration or ultrasonic sound (sound at higher than audible frequencies) tends to be used when early detection of potential failures is the goal. Nevertheless, systems like this one that use audible sound and omnidirectional microphones should be worthwhile as an automated alternative to having a person walk around the site to listen for problems.
Example Application
Example equipment monitoring applications in factories include the detection of product defects in food and beverage factories or anomalies in the blowers used in semiconductor plants, belt drives in machine-building workshops, or ventilation fans in metal processing plants. For the example application below, the graph shows the trends in noise level and degree of abnormality for a machine on a beverage production line that makes an abnormal sound before shutting down (see Figure 3).
Figure 3—Example Use of Real-time Noise Monitoring System for Equipment Diagnostics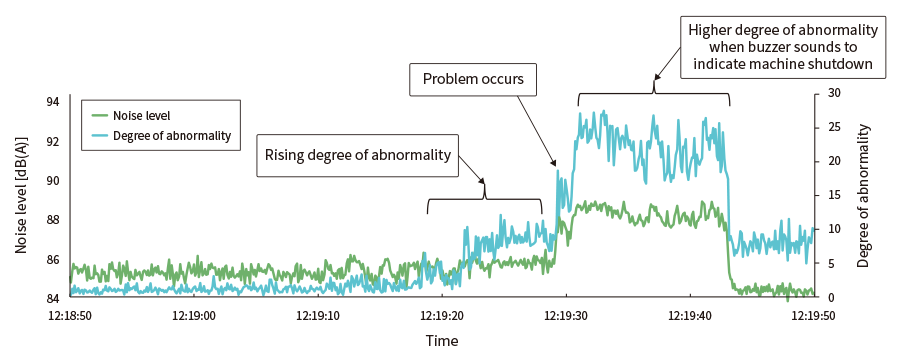 In this example, the system is used on equipment at a beverage plant. The trend graphs for noise level and degree of abnormality show the degree of abnormality rising before the problem occurs.
Study into Use of Noise Source Identification Unit to Enhance Equipment Diagnostics
While the use of omnidirectional microphones for equipment diagnostics enables detection of anomalies over a comparatively wide area, once such a detection has been made, it is often not possible to identify which machine has the problem. It was to deal with cases like this that Hitachi Power Solutions developed enhanced equipment diagnostics by means of a system that uses a noise source identification unit.
The noise source identification unit works by installing an array of equally spaced microphones and then using array signal processing to determine the sound level at each point on the planar region covered by the array. A heat map of this sound distribution is then displayed by overlaying it on a camera image.
System Configuration
The system configuration features an added noise source identification unit at the network edge (measurement points), with the server side remaining the same as that described above for equipment diagnostics using a single microphone. The noise source identification unit is made up of the following components (see Figure 4).
- Microphone array
- Microphone array housing
- Camera
- Data logger [analog-to-digital (A/D) converter, array signal processing unit, storage, and data communications unit]
- Data logger housing
Taking account of the tradeoff between directional accuracy and real-time signal processing performance, the microphone array is made up of 16 microphones arranged in a circle. The array housing is designed for permanent outdoor installation, featuring waterproof caps on the ends of the microphones to minimize interference from rainfall or wind sound. Similarly, the microphone pickup membranes are attached to the mounting plate to minimize acoustic echo. Anticipating that the measurement coverage area will need to be adjusted during installation, the unit can also be panned and tilted to change its orientation.
Figure 4—Block Diagram of Equipment Diagnostics System with Noise Source Identification Unit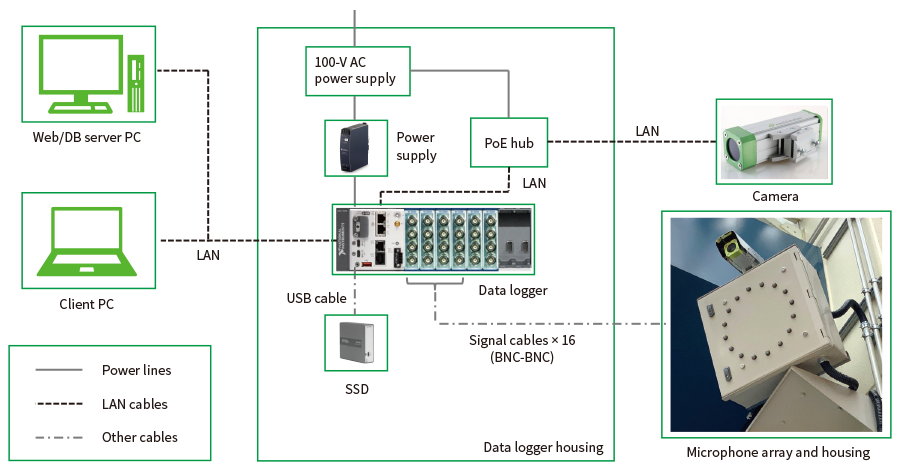 LAN: local area network, AC: alternating current, USB: universal serial bus, SSD: solid state drive, PoE: power over Ethernet*
* Ethernet is a trademark of Fujifilm Business Innovation Corporation.The noise source identification unit acquires camera images and the sound amplitude distribution along with noise level data and audio from a representative microphone. This data is collected on the server, from which the measurement data and abnormality detection results can be displayed on client PCs.
Data Acquisition
The noise source identification unit generates the following four types of files and forwards this data to the server.
- Camera images
- Noise level data for an array of points on the camera image plane (in one-third octave bands across the frequency spectrum from 50 Hz to 10 kHz)
- Noise level data from a representative array microphone (in one-third octave bands across the frequency spectrum from 50 Hz to 10 kHz)
- Audio from a representative array microphone
The current system is limited to 16 sensors, with the data sampling rate being chosen to enable all steps from data acquisition to array processing and transmission to be accomplished in real time.
How Anomaly Detection Works
The noise source identification unit is equipped with two different mechanisms for detecting anomalies, using the spatial amplitude distribution for each band of the frequency spectrum and the distribution of degree of abnormality respectively.
The amplitude distribution method uses a simple display of the data obtained by the noise source identification unit and detects anomalies by overlaying the amplitude distribution data on a camera image. As data for each frequency band is acquired continuously, the location where a sound is coming from can be identified by showing the amplitude distribution for specific frequency bands as well as the noise level.
The degree of abnormality method works by using the noise level data (including data broken down into one-third octave bands) for a grid of points on a plane corresponding to the camera image as input to MT machine learning and calculating the degree of abnormality at each point in the grid to display it as a heat map. Whereas the amplitude distribution can show the user where the noise level is high, the degree of abnormality distribution can show the locations of anomalous sounds (locations with a high degree of abnormality), even if the noise level is low.
Use of this system has demonstrated that its measurements can provide a heat map that visually highlights anomalies when changes occur in the tone or intensity of the sound from a particular source, or when a new source starts making a sound or an existing source stops doing so (including when a sound source shifts location).
Conclusions
A possible future application for the system is in environmental monitoring, measuring other variables such as odor or temperature in addition to noise. Adding odor and temperature as input variables together with additional communication data would make the system more multi-purpose. This would enable early detection by the system of equipment problems that in the past would have been identified by human senses. Examples include its potential use in solutions for automating on-site inspections by an experienced inspector, or the highly accurate remote monitoring of equipment in hard-to-reach locations.
Hitachi Power Solutions intends to leverage its extensive experience with noise monitoring systems for sites such as factories and power plants to develop these into a social infrastructure solutions business that helps customers improve the efficiency of equipment management or provides enhanced diagnostics.