
Monitoring and Optimization of Logistics Center Operations and Overview of Internal Visualization System for Warehouses
Highlight
Recent years have brought an increasing need for improvements across all aspects of logistics, prompted by the “2024 problem” (a driver shortage compounded by new restrictions on driver working hours) that confronts the logistics industry in Japan. Efficiency improvements and reforms of warehouse working practices are also pressing concerns.
Hitachi’s response has been the Hitachi Digital Solution for Logistics in which it is consolidating a suite of services that support the optimization of supply chains by collecting, aggregating, and analyzing data on customers’ logistics operations. The first step has been the provision of an internal visualization system for warehouses that acts as a service for improving warehouse operations, incorporating functions for data aggregation and presentation.
This article describes the features and example use of the internal visualization system for warehouses along with the outlook for the future.
1. Introduction
The progress of electronic commerce (EC) over recent years has driven unrelenting growth in the volume of goods handled by logistics companies. Unfortunately, it is anticipated that Japan’s logistics infrastructure will become progressively more difficult to sustain as labor becomes increasingly difficult to acquire. This is a consequence of workforce shortages resulting from a rapidly aging population and low birth rate as well as changes to regulations on working time and total at-work hours, as exemplified by the nation’s “2024 problem.” If this imbalance between workforce capacity and the amount of work to be done in the logistics industry is to be overcome, there is an urgent need for operational improvements that utilize IT.
This article details an example application of an internal visualization system for warehouses that provides comprehensive data aggregation and monitoring of warehouse operations and that was developed as a first step toward putting improvements into practice. It also reviews Hitachi’s future plans.
2. Action on Improving Logistics Center Operations
2.1 Operating Environment for Logistics
Human staff are still called on to perform much of the work done in logistics workplaces. One example is how a supervisor will go around the large interior of a warehouse to check for equipment faults and observe equipment conditions using the warehouse control systems (WCSs) that are incorporated into the various machinery. Likewise, as there is no way to see what workers are doing without going into the workplace, maintaining a personal presence is the only way of identifying work blockages or over- or under-staffing in real time.
These manual activities place a heavy burden on the supervisor and workers and bring an increased risk of service levels being degraded by an inability to get sufficient staff or problems with work becoming the preserve of specific individuals. Moreover, it becomes difficult to identify bottlenecks as actual performance is not captured as data, or is not utilized in an appropriate manner.
To improve this situation, it is essential that data on actual performance be collected, analyzed, and presented, and that simulation be used to suggest how to go about optimization, with these improvements then being put into practice. It also calls for the establishment of practices whereby this cycle can be worked through on an ongoing basis (see Figure 1).
Figure 1—Four Steps toward Improving Warehouse Operations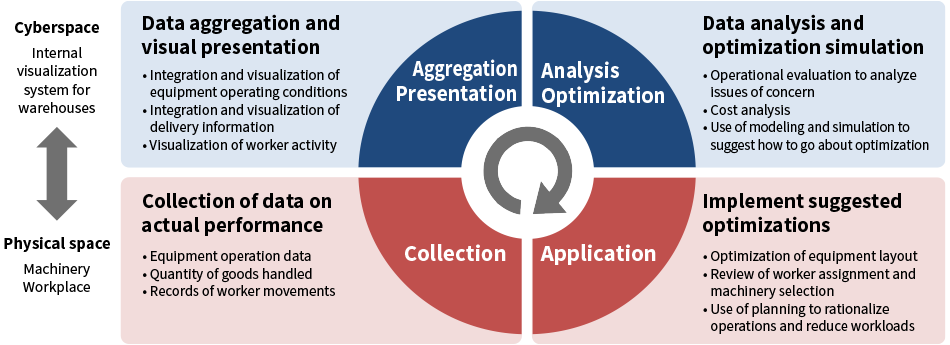 HDSL:Hitachi Digital Solution for Logistics The amount of effort supervisors need to spend on workplace monitoring can be reduced by collecting the data generated in the workplace and then aggregating and presenting it visually. The aggregated data is then used for cause analysis and modeling, with simulations being run to devise optimization measures. By putting these into practice, workloads can be reduced and efficiency improved though changes to equipment and workplace practices. Once these changes have been implemented, the cycle can then be repeated and further improvements made by continuing to collect data from the field.
2.2 Hitachi’s Vision for Operational Improvement in Logistics
Hitachi has defined four steps for the improvement of warehouse operations: (1) a data aggregation platform, (2) visualization, (3) prediction, and (4) planning optimization. Solutions have been developed for each of these (see Figure 2). The data aggregation platform collects data from the warehouse management system (WMS) and WCSs and aggregates data for visualization, analysis, and prediction in an integrated manner. The visualization step uses data on actual performance, equipment operating conditions, and so on and presents it in ways that suit user needs. The prediction step involves building a model that replicates actual operation with high fidelity. Collected data can then be utilized to run simulations and predict future operational performance or blockages in the flow of goods in a way that better reflects reality. The fourth step, planning optimization, optimizes specific work processes in a way that takes account of these predictions and other factors such as workplace-specific constraints. When taken further, adding consideration of other constraints such as the trade-offs between different processes, this facilitates warehouse-wide optimization by progressively expanding the scope of application.
The following section details an example application of the internal visualization system for warehouses, describing how the visualization step serves as a means of resolving issues.
Figure 2—Action on Implementing Hitachi’s Vision for Improvement at Logistics Centers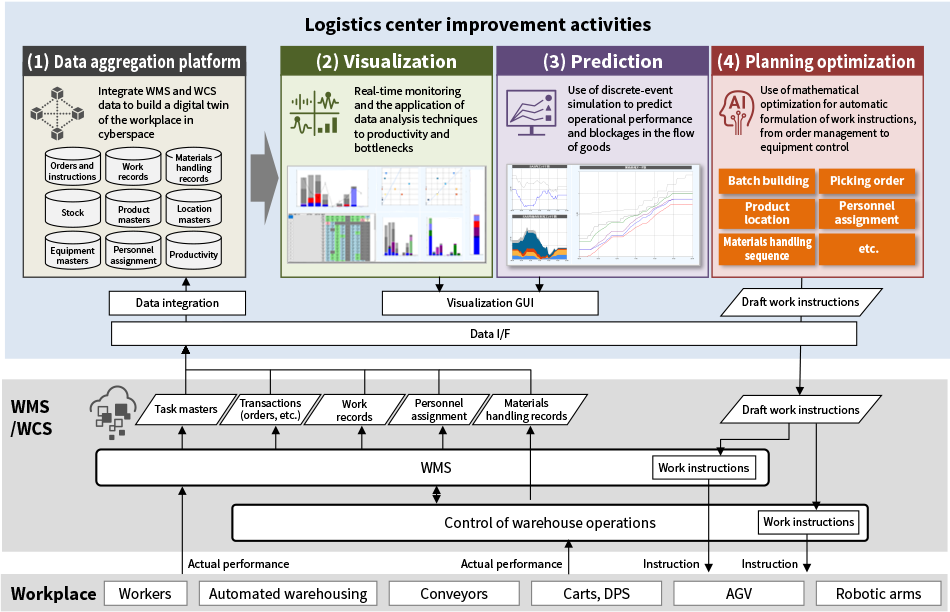 WMS: warehouse management system, WCS: warehouse control system, GUI: graphical user interface
DPS: digital picking system, AGV: automatic-guided vehicle Visualization, prediction, and optimization can be performed in cyberspace through the integration of data collected via links to the WMS and WCSs that control workplace machinery. Improvements in workplace operation can then be implemented by using the outcomes of this visualization, prediction, and optimization as feedback to the WMS and WCSs.
3. Operational Improvement for Warehouses Using Digital Technology: Example Application of Internal Visualization System for Warehouses
Adopting the internal visualization system for warehouses reduces supervisor workloads through the centralized management of data on warehouse operations and by providing a single platform that presents the operating conditions for warehouse equipment in real time.
A single screen can show the status of each automated guided vehicle (AGV), sorting machine operation, and whether any errors have occurred. This means that the supervisor can monitor what is happening in the warehouse in real time without having to go out on the floor in person. They can also respond to problems as soon as they occur (see Figure 3). It also helps to make materials handling more efficient as decisions about remote instructions for the AGVs can be made on the basis of having an overview of everything that is going on, allowing movement instructions to appropriately reflect what is happening across the entire warehouse. Similarly, by simplifying the task of retrieving data on things like sorting performance, materials handling performance, or error history, centralized management of the collected equipment performance data can reduce the amount of work required for analysis.
Adopting the service significantly reduces the amount of time spent inspecting the workplace and dealing with irregularities, meaning that supervisors spend a lot less time checking up on what is happening than they did prior to system installation. This accelerates the improvement of workplace operations by boosting administrative efficiency and by freeing up time to spend on other administrative tasks and on making improvements.
As goods to be forwarded to other sites are identified in advance, inbound goods handling at the destination can be made more efficient by preparing for the incoming goods in advance. The service also enables the suitability of work plans to be reviewed with reference to past performance data, allowing work planning to better reflect actual circumstances by highlighting previously unidentified work issues.
Figure 3—Example Monitoring of Warehouse Operations in Visualization Step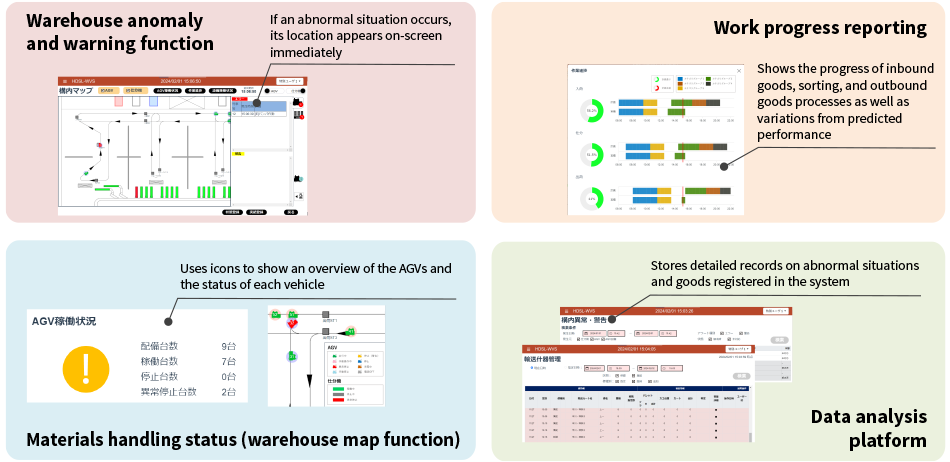 The internal visualization system for warehouses provides four main functions. The warehouse anomaly and warning function displays immediate notifications about any abnormal situations that occur in warehouse equipment on a map and in the error reporting field. Work progress reporting shows the planned and actual performance of sorting machines and inbound and outbound goods handling to provide a quick indication of any operational delays. The materials handling status display (warehouse map function) makes it easy to get a view of everything that is going on, using a map to present such information as an overview of AGV operation and their current locations. The data analysis platform serves as a basis for analysis work and can be used to search for and output the data forwarded from the equipment.
4. Conclusions
While many logistics centers continue to perform routine work manually using analog processes, the threat of future labor shortages is an issue that cannot be ignored. This in turn calls for labor-saving and efficiency improvements across all warehouse operations through repeated analysis and optimization, starting with the digitalization and visualization of workplace activities.
In response to this demand for warehouse-wide labor-saving and efficiency improvement, use of the internal visualization system for warehouses provides broad oversight of operations and functions for the centralized management of data, thereby reducing the current workload by making it simple to keep track of what is happening in the workplace.
Future plans for the internal visualization system for warehouses involve making further advances in the switch to data-driven practices at logistics centers and in their monitoring, with acquisition of a wide variety of data. Hitachi also plans to expand solutions that use this acquired data to optimize equipment scheduling and control and that facilitate warehouse-wide optimization, encompassing both operations and equipment. By aggregating and exchanging data across different sites, the intention is also to achieve comprehensive optimization across customers’ entire supply chains in the form of support for management decisions. Examples include the development or consolidation of sites as well as route optimization for the transportation of goods between sites.
By undertaking this work in partnership with customers involved in the logistics industry, Hitachi intends to contribute to advancing the businesses of a wide range of customers.